I have chosen the LPC Scale as the intervention me
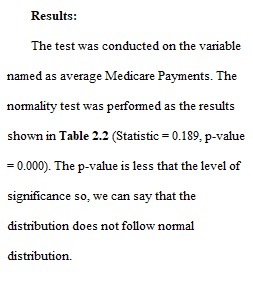
Q Week 2 Homework Assignment (20 points) This week’s assignment gives you practice in examining real world data. Instructions: Open data IPPS.SAV Select only cases from the state of Michigan. Remember to use quotation marks in your selection command.....SELECT IF (STATE = "MI"). Whenever we are using logical operators (<, =, or > ) for string variables, we have to use quotation marks (" "). Next, select only cases from the Grand Rapids Region Conduct a normality test for average medicare payments (MPAYMENTS). Report your results in form of a table similar to Table 2.2. Provide a statement on whether average medicare payments are normally distributed based on your results Create a histogram with an overlaid normal distribution curve similar to figure 2.6. Save all your commands to a syntax file Deliverables: Word document in APA style formatting containing: Table of normality test results with a statement about the results of the test Histogram with an overlaid normal distribution curve Brief comments about the average medicare payments based on your the histogram SPSS Syntax file
View Related Questions